Overview
The dashboard is your starting point for understanding how your agents are performing. It surfaces session volume, resolution rates, token usage, and cost across the agents in your project. From here, you can view individual sessions to debug and understand how your users are interacting with agents.Dashboard
What you’ll see
- Session volume — how many sessions ran over the selected period.
- Resolution rates — how often agents resolved a given user intent in a session.
- Correction rates - how often users had to correct an agent in a session (i.e. ‘that’s not the right date’)
- Token cost — llm token cost broken down by selected agent across selected date range.
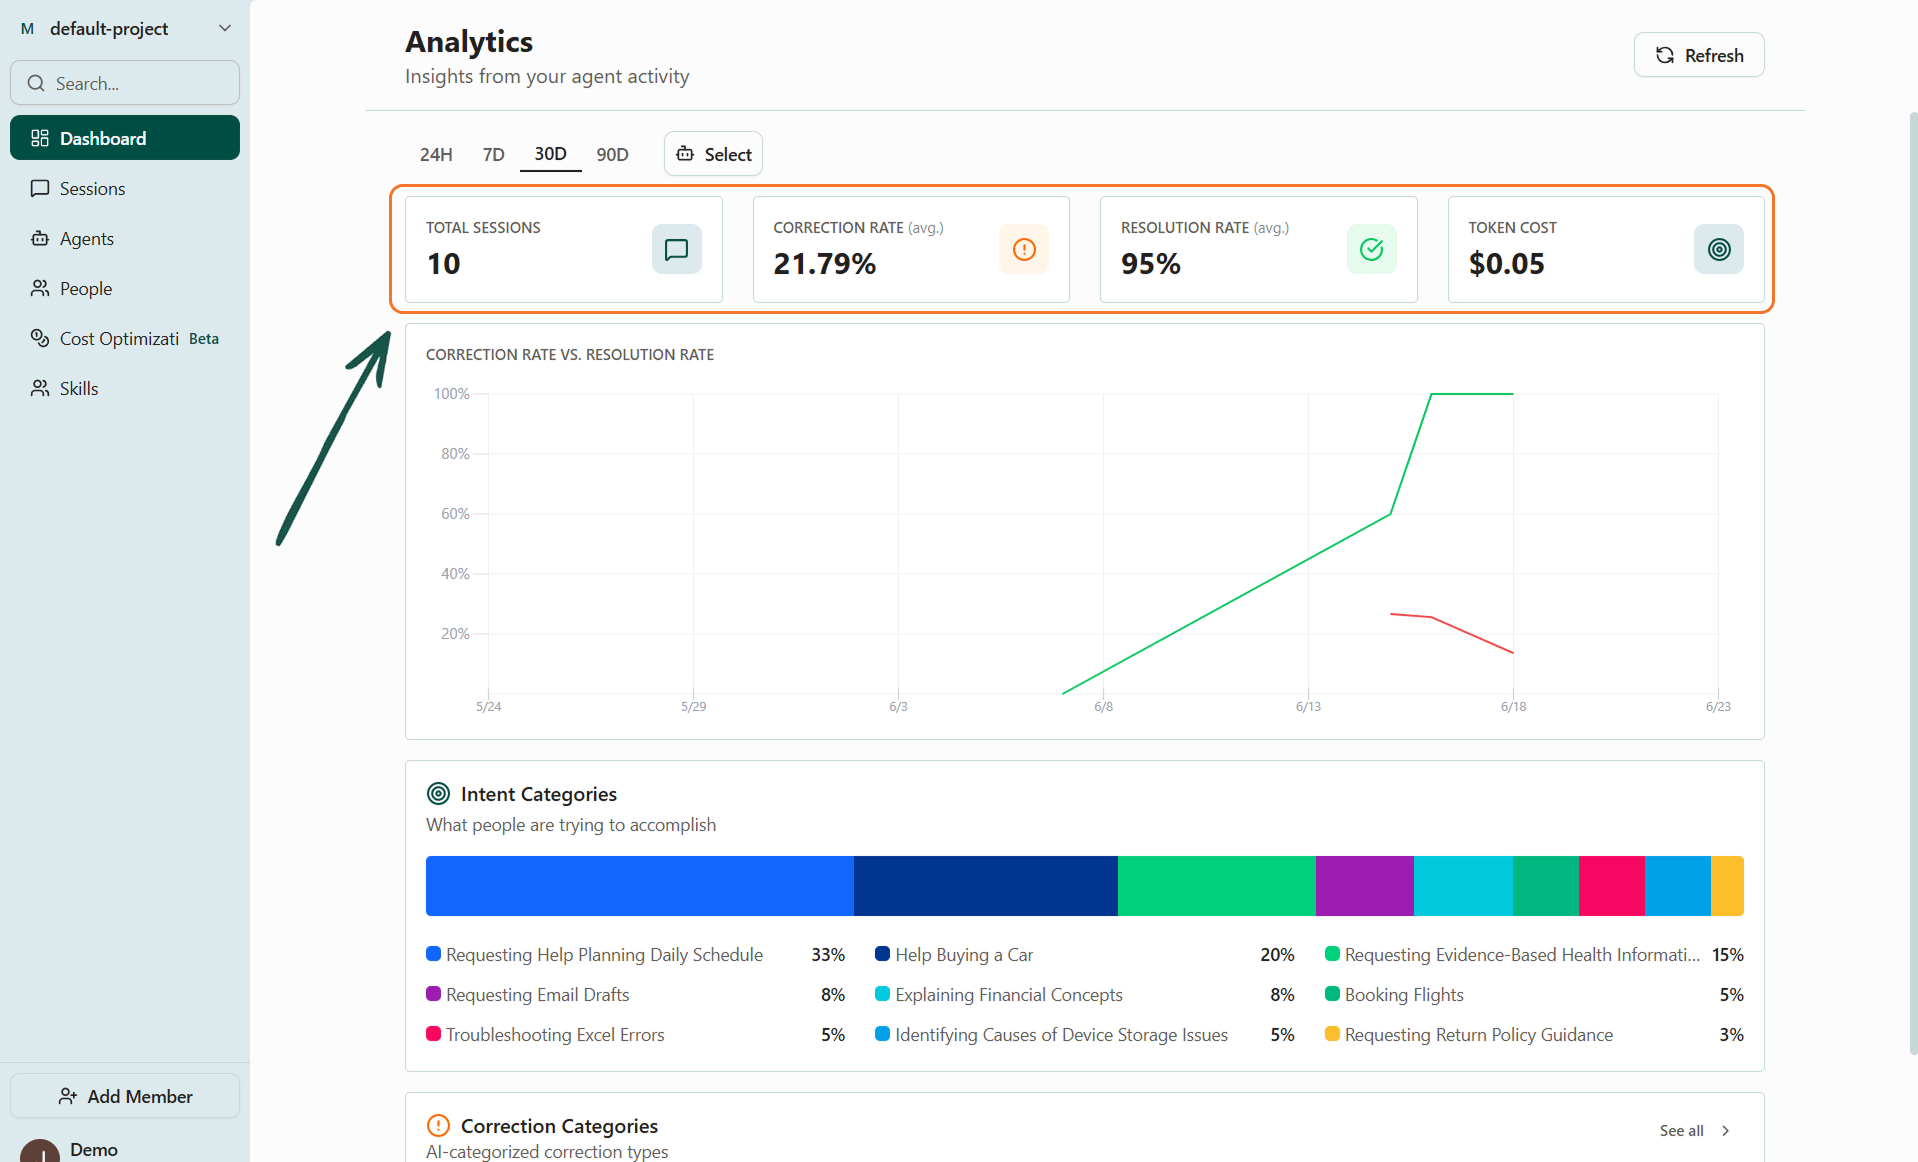
The dashboard's top-level view of agent performance
Filters
Use the time period and agent filters at the top of the dashboard to narrow the view only to what you want to see.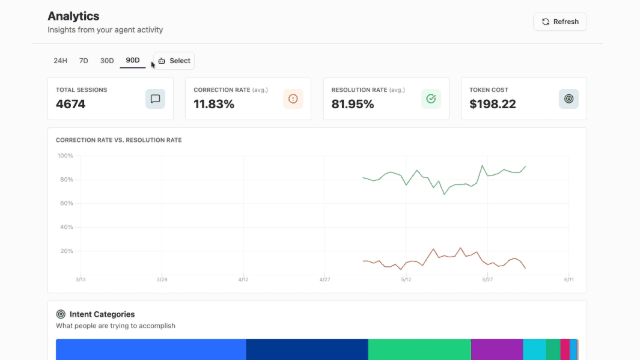
Filter by agents, date, and more
Up next
- Categorization — User intents need categorizations at the aggregate level. Same with corrections. Get there from the Dashboard, Sessions, or the Agent pages.